
Monday May 16, 2016
Othman MESLOUH, for ‘Share VIEWS’ and ‘Cercle des Volontaires’


Mostafa BELKHAYAT and his “Gravity Center Indicators”
Short biography, professional career, works and nominations:

Mostafa BELKHAYATE is a Moroccan trader born at El Jadida. He got his baccalaureate degree in 1982 and went to Paris where he obtained a Master of Economics (University of Paris X, Nanterre). He won the stock championship organized by “La Vie française” journal. In 1995, and seen his distinctions, he worked for “Crédit Suisse” and thus knew some reputable brokers. Four years later, a trading league « Gérer 20.000$ » (understand “Manage 20.000$” in English), was organized by the Association of International Traders of Geneva from October 98 to April 99. He wanted to participate to this league but he does not have enough funds, so he launched a support call through his newsletter. Nickie WILSON, the financial advisor of Michael Jackson at this time, read his call and opens him an account at www.interactivebrokers.com
Since the beginning of the championship and until the end of the challenge, Mostafa remained ahead and the initial 20.000$ became 106.000$, thus he realized 403% performance. The American star was so proud of this performance and invited him to meet him personally at Los Angeles before beginning together a tour to meet the African leaders in his own jet.
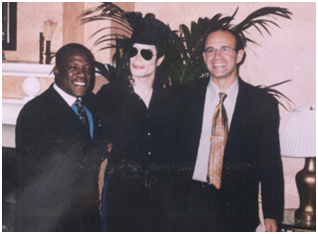
A photo of Michael JACKSON and Mostafa BELKHAYATE
Mostafa then returned to Morocco and makes grasp ideas on management software about trading. He moved to Marrakech and became an international consultant in the stock markets. He worked with Lars WINDHORST, the business guru, nicknamed the German Bill Gates.
Mostafa BELKHAYATE is called a « visionary » because of his accurate works and prediction of several events like:
- The end of the Internet bubble in November 1999, the collapse of markets and also publishes on online forums and in newspapers a long analysis explaining the end of the gold bear market and the beginning of the inevitable decline of the dollar;
- In July 2001 he hits the headlines by publicly announcing that « America will be attacked from all sides in September 2001« . He based his prediction on the charts of the NASDAQ, airlines and US treasury bonds. Five minutes after the collapse of the first tower, Mostafa published in a comment letter, which reveals today, 15 years later, a surprising vision;
- In 2002, while one dollar equals one euro, Mostafa publicly demonstrated in the press and several conferences that the EUR/USD ratio will reach 1.40 over the next 5 years [1];
- While the barrel worth 25$ in 2003, Mostafa surprises his subscribers of ‘BELKHAYATE Letter’ by announcing that a barrel of oil will reach 100$ before 2010;
- While the ounce of gold was about 380$ in 2004, Mostafa publishes an innovative graphic based on the ratio of gold and oil to explain the imminent surge in gold reaching 750$ before 2008 [2];
- Invited on the Swiss television ‘Leman Bleu‘ in 2005[3], he said « now gold will upstage the dollar » and reveals for the first time his indicator ‘BELKHAYATE Gravity Center‘ to explain why gold and oil will continue to go up in price. He also offered for free the program of his indicator during the ‘Technical analysis show’ of Paris;
- In 2006, the Canadian fund ‘Mansa Moussa Gold Fund‘ run by Mostafa was ranked by Bloomberg as best fund in its category in terms of relative risk/performance. This earned him the world title of best gold manager in 2006-2007;
- In 2007, Mostafa manages to extract from the gold market a steady return of 4% per month over a period of 40 months. Especially that it was impossible for him to use short selling seen the fact that he was operating only in the physical gold market. In October, Mostafa published an open letter to Dominique STRAUSS-KHAN, then Director of the IMF [4];
- In 2008, Mostafa was invited by ‘Bloomberg TV’ [5] to comment on both his prizes and predictions concerning the international markets. In September 2008, he published « An open letter to my Prime Minister » (M. Abbas EL FASSI, last Moroccan prime minister) were Mostafa stipulated clearly that Moroccan gold reserves were extremely low (22 tons) and remained constant during decades;
- In 2009, Mostafa is nominated « Gold Award » at Paris, during the ‘Show of technical and graphical analysis’ [6];
- In 2010, Mostafa creates and manages the first hedge fund dedicated exclusively to physical gold, not paper gold: ‘Aurum Swiss Corporation’. He sold it two years later to finance the project of his life: ‘Gold Reserve Sukuk’ which is the first asset-backed Sukuk in the Islamic finance history that empowers investors to invest in physical gold through a robust Shari’ah-compliant structure. During the same year he was awarded at ‘AT Salon’ for improving ‘BELKHAYATE Gravity Center’ algorithm;
- In 2011, Mostafa finalized his automatic trading system, always based on the ‘Center of gravity’ method and proposed it to ‘Progressive Trading Group’ broker of Los Angeles. His improved and autonomous new algorithm is considered as the best one among hundreds of algorithms of all nationalities, with an average yield of 6 % per month over 24 months. The algorithm worked autonomously without human intervention and has achieved 100% of trades [7];
- In 2012, Mostafa made another improvement of his indicator and was rewarded the ‘Silver Trophy’ by ‘AT lounge’. He moved to Dubaï to establish ‘Gold Reserve Sukuk’[8], the first financial tool to hold gold outside the banking system while benefiting from both collateral and absolute liquidity as listed on NASDAQ Dubai;
- Finally, in 2014, ‘Gold Reserve Sukuk’ obtained the approval of regulatory authorities, as well as major local and international banks of Dubaï. The dream became reality.
What’s the ‘BELKHAYATE Gravity Center’ and how does it work?
To analyze a chart, Mostafa BELKHAYATE uses two indicators which are both based on the concept of center of gravity of a stock market move.
- The first indicator, ‘BELKHAYATE Gravity Center’, calculates the dynamic center of gravity of a market. It is represented by parallel stripes that appear to serve as supports and resistances;
- The indicator ‘BELKHAYATE Timing’ calculates the static center of gravity. It is represented by the chart below the price chart and provides optimal probability areas to buy or sell.
Just after a brief observation of these two indicators, they allow an immediate visibility on the potential evolution of a market. The trader will thus know whether to buy, sell or wait future potential fluctuations.
This indicator uses a sophisticated mathematical formula (non-parametric polynomial regression) to calculate the center of gravity of a stock movement (blue line) and 3 standard deviations above it (red stripes) and 3 below it (green stripes). The amplitudes of these stripes correspond to proportions of the “golden number” φ :
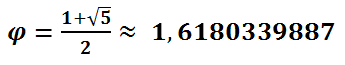
A picture is worth a thousand words:
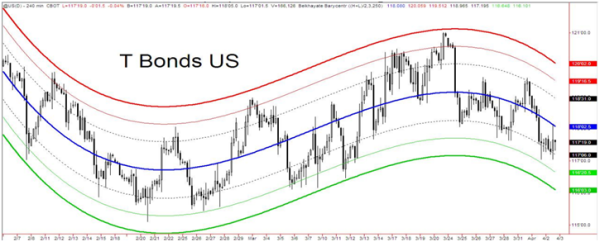
Example: Evolution of the US T-Bills from February 6, 2014 to April 3, 2014
- The first observation is that all financial markets oscillate around their center of gravity. They exaggerate upward and downward but in a relative way;
- The amplitude of these exaggerations is not hazardous, on the contrary, as seen on the chart above (the market for US Treasury bills); the amplitude is very often equal to the precise proportions of the golden number compared to the dynamic of the gravity center of the market;
- The blue curve, representing this dynamic center of gravity, gives us immediately the visual direction of the current market trend (which is bearish in this case) seen the fact that the blue curve is bent downward;
- The red and green lines indicate the extreme market “breath” amplitudes: In other words, its volatility. Like all markets, they oscillate in a relative elasticity according to their center of gravity. These extreme lines are very important to make decisions (buy or sell);
- For sellers, the principle of this indicator is basically simple: when price enters the area contained by the two red curves, it is a strong indication to sale (because the probability that the market returns, like a rubber band, to its center of gravity is about 90%) and vice versa when the price enters the low zone contained by the green lines;
- The corollary of this principle is that it is not recommended to buy when the price is above the center of gravity, or sell when below.
What’s the ‘BELKHAYATE Timing’ indicator and how does it work also?
Let’s consider the chart of the ‘Eurodollar’ during the same period (from February 6, 2014 to April 3, 2014):
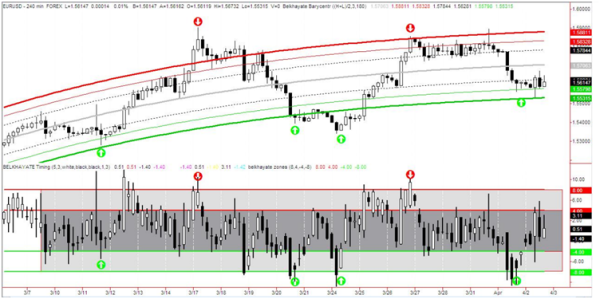
EUR/USD from February 6, 2014 to April 3, 2014
The ‘BELKHAYATE Timing’ indicator is an oscillator which must be combined with ‘BELKHAYATE Gravity Center’ and it provides 3 types of areas:
- The « dark gray » area of the medium which represents the centroid of the area. When the price is in this area, it is recommended to do nothing because the probability of being right (or wrong) is about 50%. This is a neutral zone where you have to be patient and prepare the next position;
- The « gray » areas represent extreme areas where it is recommended to take profits. It is recommended to sell the position in the « gray » area contained by the red lines and redeem its position in the « gray » area contained by the green lines. And this, of course, in agreement with the basic principle of the ‘BELKHAYATE Gravity Center’ indicator;
- The white areas beyond extreme areas, called warning areas, issues buying and selling signals with a high probability of success.
Can we predict a crash with those indicators?
As we’ve seen, the indicators of Mostafa BELKHAYATE are for short-term approaches and uses. But, let’s analyse the S&P500 step by step from short-term to long term:
- Trading analysis minute by minute: From Friday May 13 till today Monday May 16, 2016.
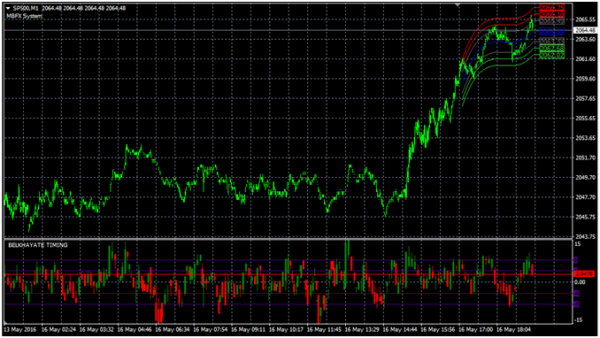
S&P500 evolution from Friday May 13 till today Monday May 16, 2016
We notice clearly that the S&P500 is struggling and seems to increase with severe difficulties. Its dynamic gravity center is about 2064 points and it reached 2066 points few minutes before which means that the market has to visit lower values in few minutes. When extreme areas of ‘BELKHAYATE Timing’ indicator are reached, we notice clearly both brief upward and downward behaviours of the market.
Note: These statements were made at Paris with MetaTrader 4 @18h (local time).
- Trading analysis hour by hour: From Friday March 11 till today Monday May 16, 2016.
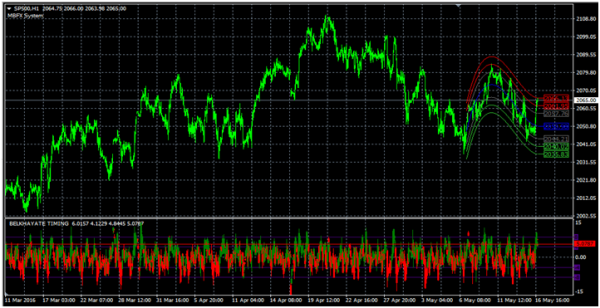
S&P500 evolution from Friday May 13 till today Monday May 16, 2016
This time we observe an averaged down trend during one week. But the ‘BELKHAYATE Timing’ indicator reached the upper extreme area which means that the S&P500 might raise higher values during one week or more.
- Trading analysis day by day: Friday November 2, 2012 till today Monday May 16, 2016.
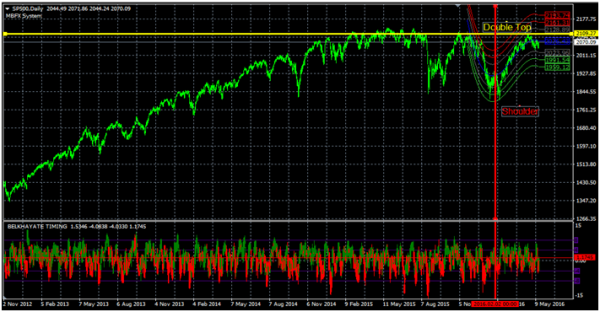
S&P500 evolution from Friday November 2, 2012 till today Monday May 16, 2016
Since the beginning of November 2012, we notice clearly a bull market on the S&P500 due to all the Quantitative Easing (essentially QE3) made by Ben Shalom BERNANKE former chairman of the FED (Federal Reserve).
But since August 2015, we observe that the S&P500 oscillate between 1850 and 2100 points. We also notice a double top on the beginning of November 2015 and another one last April. A little peak (shoulder) occurred on last February 2, raising slightly the market to 1930 points. This could presage a crash if another peak (shoulder) higher than last one appears within days or weeks to come up.
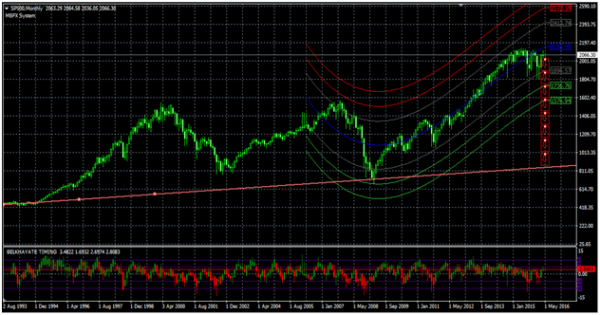
- Trading analysis month by month: From August 2, 1993 till today Monday May 16, 2016.
S&P500 evolution from August 2, 1993 till today Monday May 16, 2016
As said before, a crash can occur in the next days, weeks or months. But let’s observe a little bit the chart before. We see clearly that during the crisis of 2008, the gravity center of the S&P500 according to Mostafa’s method reached its extreme low once the crisis finished and once the new bull market began: In other words, there is a delay of few weeks or months between reaching the minimum center of gravity market’s value and the onset of a crisis. We see now that the extreme high is beginning to be reached…
If in the coming weeks Dragonfly Doji appears, there’s a huge probability to attend a severe correction of the S&P500. I’ve also traced the trend line of the market since 1993 and if the crash occurs, the market may fall to less than 900points…
During the DotCom bubble, the bull market and the bear market lasted respectively 62 weeks and 30 weeks. During the crisis of 2008 new ones lasted respectively 59 weeks and 16 weeks. This means that the bull markets lasted almost the same duration but the deflationary crash of 2008 was twice as fast as the DotCom bubble burst. Now we are facing a bull market on the S&P500 during 86 weeks…
Before finishing this global analysis, I’ve found on the net an article of Corey ROSENBLOOM [9] called ‘A Technical Look at the 1987 Stock Market Crash’ were he highlighted what he called a “Cradle Trade” after correlation of the moving averages during 20 days and 50 days and analyzed the momentum of the S&P500.
Personally, I’ve noticed first of all during the last two crises that when the momentum of the S&P500 remained below 100 during several weeks or months a recession happened.
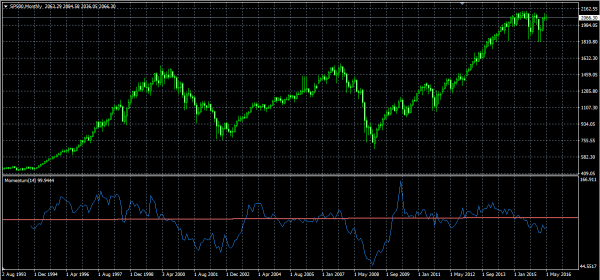
Correlation between the momentum and evolution of the S&P500
I’ve also noticed that the intersection of the moving averages of 10 days and 20 days were progenitor of severe stock market crash or a beginning of a new bull market on the S&P500.
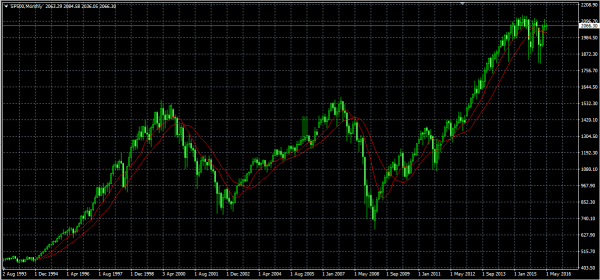
Moving averages intersections
How this will end? God only knows and the future will tell…
Othman MESLOUH.
Sources:
[1] http://www.belkhayatelab.com/uploads/presse/2004_forecasts%20-%20VIEECO%202004.pdf
[2] http://www.belkhayatelab.com/uploads/presse/Interview-Hebdo.pdf
[3] https://www.youtube.com/watch?v=dNO_x7fVw1U&feature=youtu.be
[4] http://www.belkhayatelab.com/uploads/papiers/lettre-ouverte-a-DSK.pdf
[5] https://www.youtube.com/watch?v=zf9hOVQAPE4&feature=youtu.be
[6] https://www.youtube.com/watch?v=_dU-DU5IFpo&feature=youtu.be
